
What Is Geospatial Data?
Geospatial data is the broad category of information that contains a geographic or location-based component.
Examples include:
-
Property boundaries
-
Address datasets with latitude and longitude
-
GPS coordinates
-
Census statistics linked to geographic areas
-
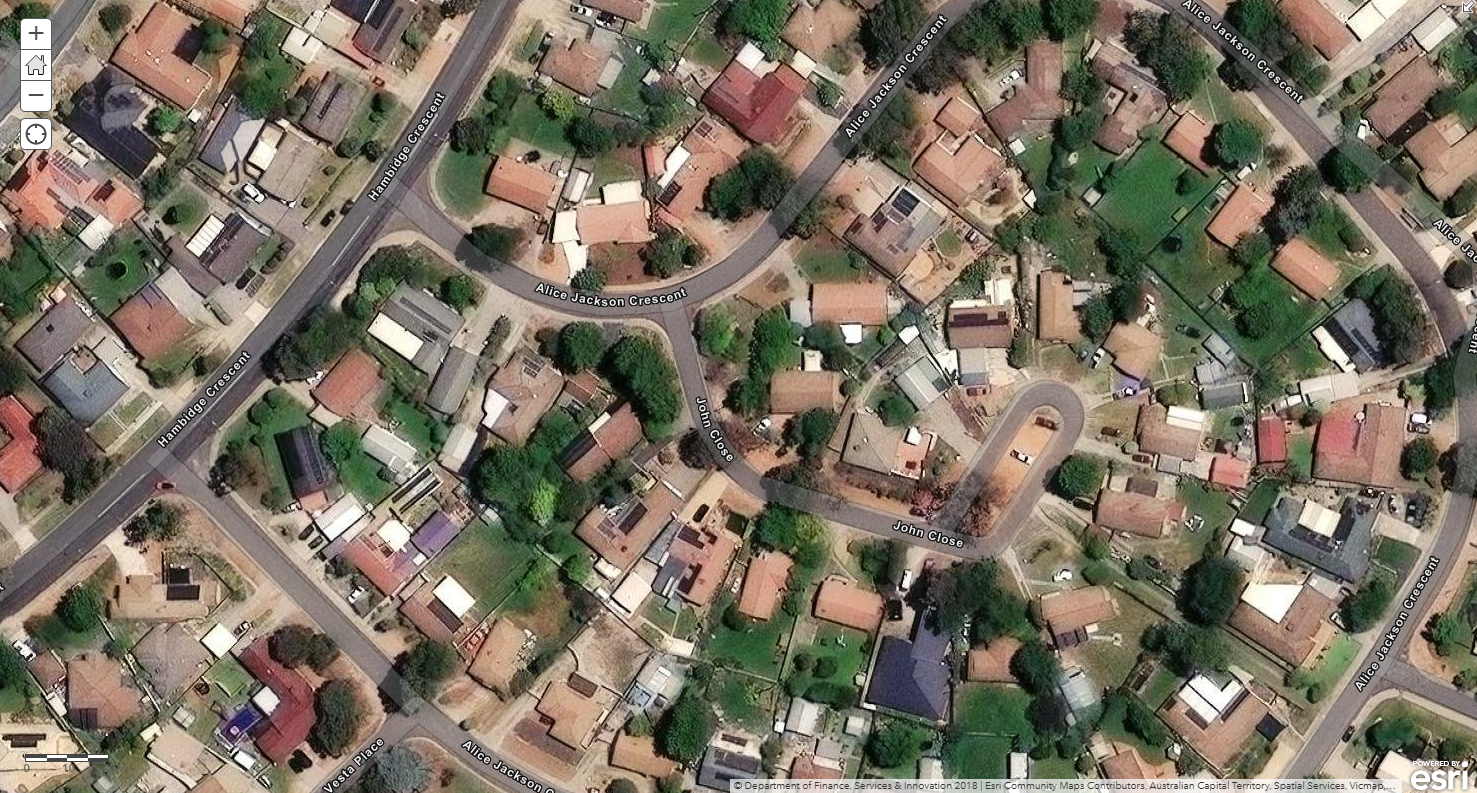
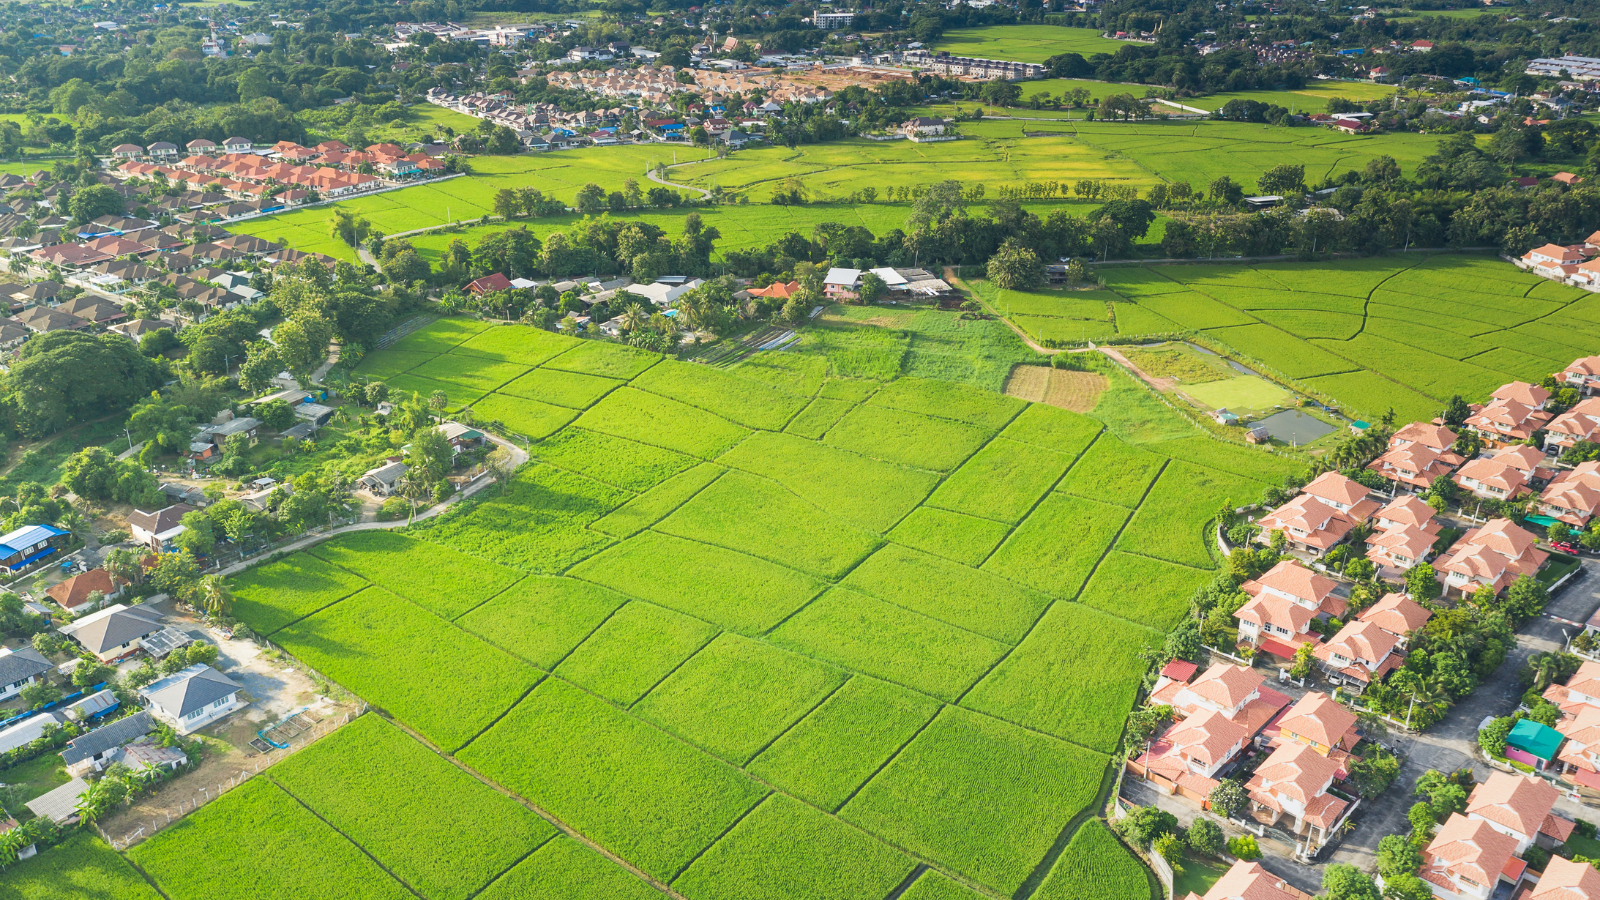
Satellite imagery
-
LiDAR point clouds
-
Environmental monitoring data
Geospatial data is commonly stored in two formats:
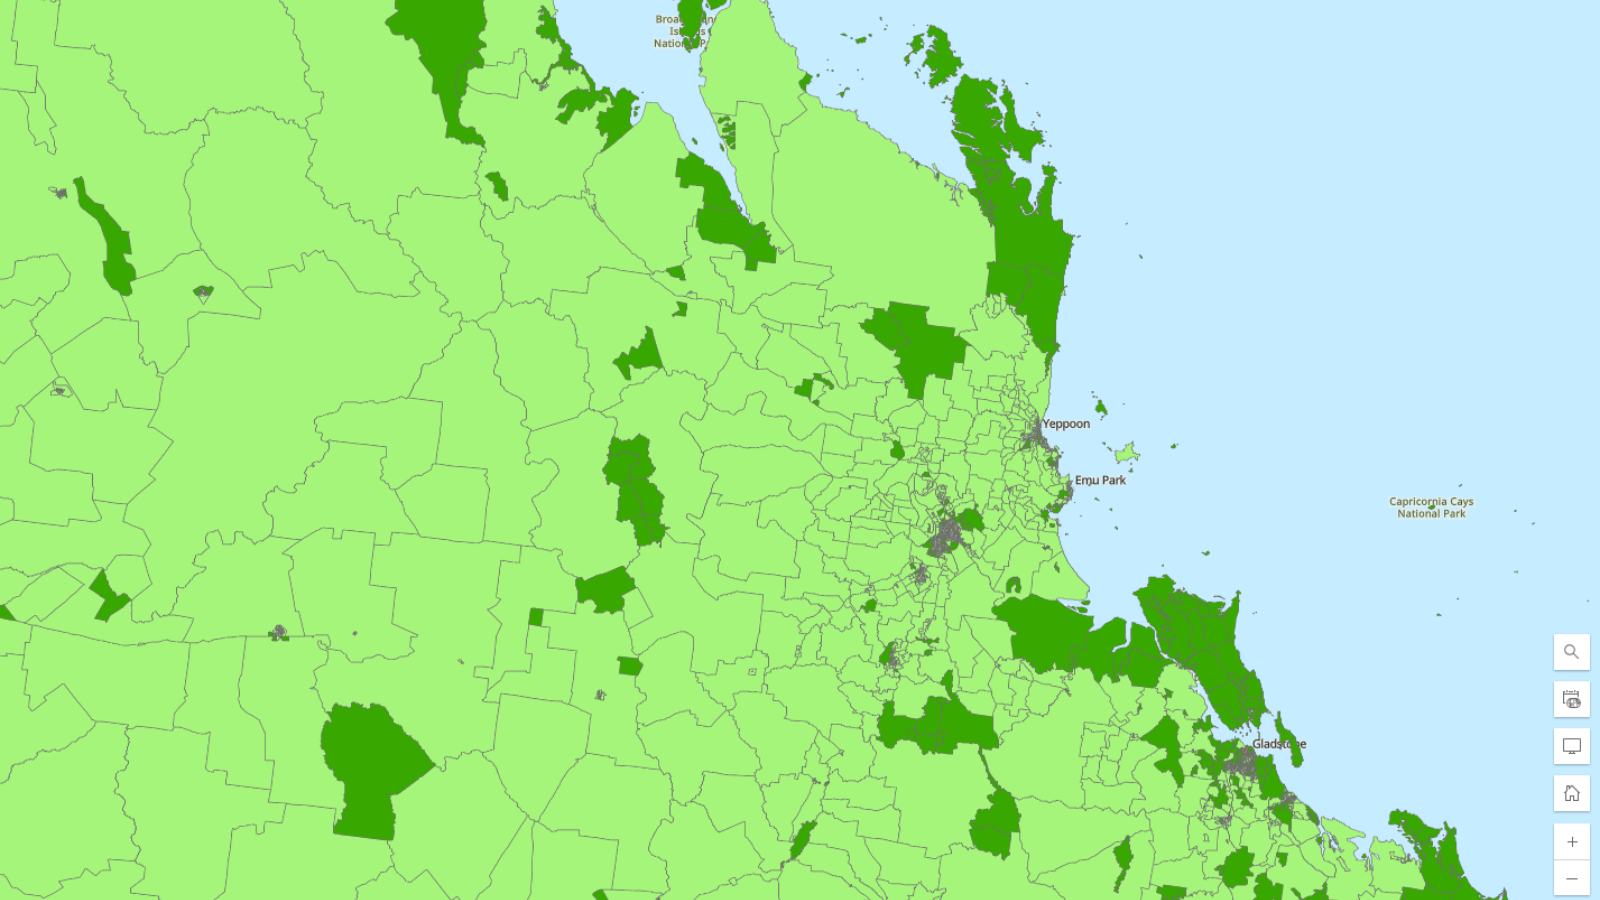
1. Vector data (points, lines and polygons) and
2. Raster data (grids or imagery such as aerial photography and satellite imagery).
Not all geospatial data is immediately visible on a map. Some datasets may consist of millions of coordinates, sensor readings, images, or records that require processing before they can be visualised or analysed.
Why is Geospatial Data Important?
Many business decisions have a geographic dimension. Understanding where people, assets, customers, risks, or opportunities are located can provide valuable insights that may not be apparent in traditional datasets.
Organisations use geospatial data to:
- Identify growth and investment opportunities
- Analyse customer and market catchments
- Optimise network and infrastructure planning
- Assess environmental and climate-related risks
- Support site selection and expansion strategies
- Improve operational efficiency and resource allocation
By combining location intelligence with business data, organisations can better understand patterns, relationships, and trends across geographic areas.

What is Geospatial Visualisation?
Geospatial visualisation is the process of presenting geographic and location-based data in visual formats such as maps, charts, dashboards, and interactive applications.
By transforming complex spatial data into intuitive visuals, it helps people identify patterns, trends, relationships, and anomalies that may be difficult to detect in raw datasets.
Geospatial visualisation builds on traditional mapping techniques by incorporating interactive and analytical capabilities that make spatial information easier to explore and understand.
Modern visualisation tools can generate everything from simple maps to sophisticated 3D models and real-time dashboards, helping organisations derive meaningful insights from geographic data.
Geospatial visualisation plays a critical role in helping organisations and individuals:
- Develop a deeper understanding of places, environments, and spatial relationships.
- Identify trends, patterns, and connections that may not be apparent in tabular data.
- Communicate complex information in a way that is accessible to both technical and non-technical audiences.
- Analyse historical changes and monitor evolving geographic conditions.
- Address location-based challenges and support evidence-based decision making.
- Build location intelligence that drives operational, strategic, and commercial outcomes.
Geographic information can take many forms, including:
- Points representing specific locations, such as customer addresses or assets.
- Lines showing connections or movement, such as roads, utility networks, or transport routes.
- Polygons defining areas and boundaries, such as suburbs, land parcels, or sales territories.
- Continuous surfaces representing phenomena such as temperature, rainfall, or elevation.
- Time-based trajectories that track movement over time, such as vehicle journeys or migration patterns.
Geospatial visualisation is widely used across industries including logistics, retail, urban planning, environmental management, public safety, telecommunications, and property.

Geospatial Data Visualisation Tools
A wide range of tools are available to help organisations transform raw geospatial data into maps, dashboards, and interactive visualisations. The right solution depends on factors such as data volume, technical expertise, analytical requirements, and whether the goal is exploratory analysis, business reporting, or application development.
Most geospatial visualisation tools fall into five broad categories:
1. Business Intelligence and Reporting Tools
Business intelligence (BI) platforms allow users to combine location data with business metrics and visualise results through interactive dashboards and reports. These tools are designed for accessibility, enabling non-technical users to explore geographic trends through drag-and-drop interfaces.
Examples include Tableau and Microsoft Power BI, which offer built-in mapping capabilities alongside broader data visualisation and analytics features.
2. Geographic Information Systems (GIS)
GIS platforms are purpose-built for managing, analysing, and visualising spatial data. They provide advanced capabilities for mapping, spatial analysis, data editing, modelling, and 3D visualisation.
Popular GIS platforms include ArcGIS Pro and the open-source QGIS . These tools are widely used by government agencies, urban planners, environmental scientists, utilities, and property organisations that require sophisticated geospatial analysis.
3. Cloud-Based Mapping Platforms
Cloud mapping platforms simplify the creation and sharing of interactive web maps without the need for extensive infrastructure. Users can upload datasets, connect external data sources, and publish maps for collaboration and public access.
Examples include ArcGIS Online, CARTO, and Mapbox, which provide scalable mapping services, analytics, and application development capabilities.
4. Spatial Databases and Data Processing Tools
For organisations working with large geospatial datasets, spatial databases and processing tools provide the foundation for storing, managing, transforming, and analysing location data at scale.
Solutions such as PostGIS and GDAL enable organisations to perform complex spatial queries, automate data preparation workflows, and integrate geospatial data into enterprise data platforms.
5. Web and Mobile Mapping Libraries
Developers building custom applications often use mapping libraries and APIs to embed interactive maps directly into websites and mobile apps. These tools provide flexibility to create tailored user experiences and integrate location intelligence into business systems.
Common options include Leaflet, OpenLayers, Google Maps Platform, ArcGIS for Developers, and Mapbox APIs.
Choosing the Right Geospatial Visualisation Tool
The best geospatial visualisation tool depends on the specific use case.
Organisations seeking quick insights may benefit from BI platforms with built-in mapping, while those requiring advanced spatial analysis often rely on GIS software.
Businesses building customer-facing applications may choose web mapping libraries and APIs, while enterprises managing large-scale spatial datasets typically combine databases, processing tools, and cloud-based mapping platforms.
Ultimately, the most effective tools are those that make geospatial data easier to explore, understand, and turn into actionable business insights.
Geospatial Data from Data Army Intel
Data Army Intel offers a range of geospatial data at your fingertips, instantly accessible and ready to query in Snowflake. Only available from the Snowflake Marketplace.
More Intel from Data Army


Intel In Your Inbox
Sign up to our newsletter and receive our latest knowledge articles, practical guides and datasets.